![]()

FW

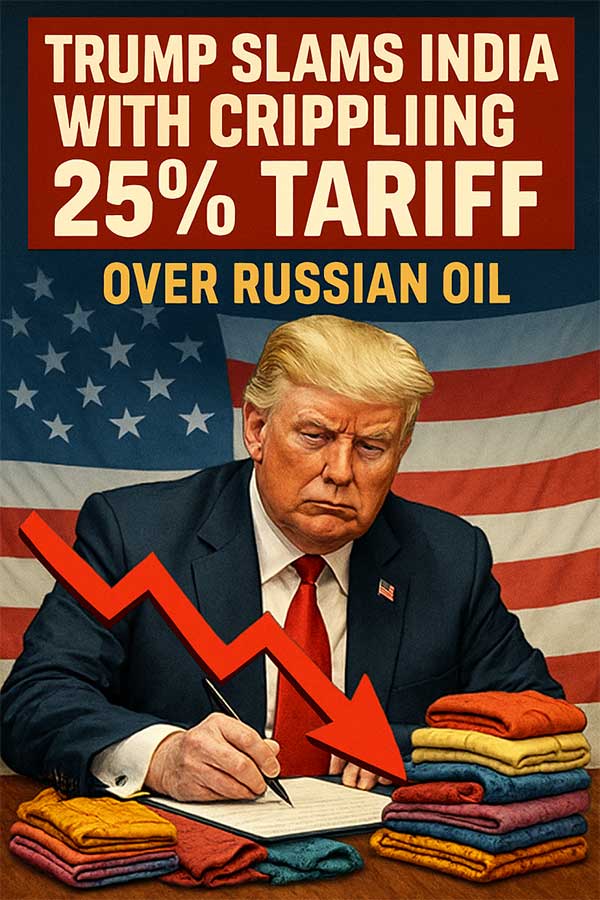
Reacting to US President Donald Trump's announcement of a 25 per cent tariff and a penalty on Indian imports, Sudhir Sekhri, Chairman, Apparel Export Promotion Council (AEPC), stated, though higher than anticipated, the impact of the new tariffs will be mitigated with the signing of the interim Bilateral Trade Agreement (BTA) between India and the US between October and December 2025.
Sekri noted, the ‘penalty’ is a ‘grey area’ and hoped the Indian government would negotiate a resolution with the US before August 1, 2025.
Accounting for a 33 per cent share of India's total garment exports in 2024, The US is a critical market for India's ready-made garment (RMG) exports. India's market share in US garment imports has steadily increased from 4.5 per cent in 2020 to 5.8 per cent in 2024, placing it as the fourth-largest RMG exporter to the U.S.
Globally, China remains the top exporter to the US, holding a 21.9 per cent market share in 2024, a decrease from 27.4 per cent in 2020. Together, China, Vietnam, and Bangladesh supplied 49 per cent of all U.S. apparel imports in 2024.
The top three apparel products exported by India to the US include cotton T-shirts making up for 9.71 per cent of India's total RMG exports to the US; women's or girls' cotton dresses accounting for 6.52 per cent of exports and babies’ cotton garments representing 5.46 per cent of exports.
These three products hold a significant share of the total US imports for their respective categories, with shares of 10 per cent, 36 per cent, and 20 per cent respectively.
Once celebrated as a textile stronghold bridging East and West, Türkiye’s garment and textile sector now faces numerous crises. From runaway inflation and soaring wages to a depreciating currency and tightening environmental regulations, the very fabric of the country’s textile dominance is under pressure. The once-iconic ‘Made in Türkiye’ label—synonymous with quality, speed, and proximity to Europe—is increasingly at risk, particularly in the mass-market segment, as manufacturers scout for more cost-effective production bases abroad. This reckoning marks more than a cyclical downturn; it highlights a fundamental restructuring of Türkiye’s position in the global textile value chain.
Economic strains fray the edges
At the heart of Türkiye’s textile woes is a potent cocktail of economic instability. Inflation, which exceeded 75 per cent year-on-year in 2024, has battered business confidence and dramatically inflated production costs. While the increase in Türkiye’s minimum wage to 17,002 TRY (about $520) is a welcome boost for workers, it has hit labor-intensive sectors like textiles especially hard. Garments produced in Türkiye are now estimated to be 60 per cent more expensive than those from East Asia, and about 45 per cent costlier than equivalents made in North African countries.
Adding to the strain is the Turkish Lira’s relentless slide, depreciating from 18.6:$1 in 2022 to nearly 40:$1 in 2024. This devaluation may seem advantageous for exporters, but it inflates the cost of imported raw materials and machinery—essentials for Türkiye’s vertically integrated production chains.
Moreover, electricity and logistics costs have nearly doubled. In April 2025, household retail electricity tariffs rose by 25 per cent, with a 10 per cent hike for industrial consumers, directly impacting operating budgets. The outcome? Shrinking margins, falling output, and vanishing jobs. Textile production is currently operating at just 50-60 per cent of normal capacity, and the workforce has contracted by over 300,000 in two years, from 1.25 million in 2022 to under 950,000 in 2024.
Environmental ambitions, a double-edged sword
Compounding the economic pressures is Türkiye’s shift toward a green economy. While commendable for its long-term vision, the government’s stricter environmental regulations—especially for pollution-heavy operations like textile dyeing—have imposed additional burdens on manufacturers.
Factories are now required to invest in cleaner technologies, obtain new environmental permits, and comply with tougher compliance standards. While these steps are necessary for sustainability, they add another layer of cost and operational complexity. Many industry insiders warn that such requirements, if not paired with government support or phased implementation, could accelerate the decline of small and mid-sized textile firms.
Exodus vs. evolution
As domestic conditions tighten, many Turkish manufacturers are actively relocating operations abroad to preserve competitiveness. Bangladesh, Pakistan, and Egypt have all received significant interest, but Uzbekistan has emerged as a breakout star.
What works for Uzbekistan is its proximity to CIS markets as its geographically positioned as a logistics bridge to Russia, Kazakhstan, and Kyrgyzstan. Lower labor cost is another attraction and a substantial cost advantage in wages and overheads. Favorable energy prices and policy support is another plus as the Uzbek government actively promotes textile sector investment, particularly from Turkish firms. Meanwhile, Uzbekistan has achieved 100 per cent conversion of its domestic cotton into yarn, offering a full supply chain in-country. And it has duty-free EU access, unlike many Asian competitors.
The transformation isn’t hypothetical as case studies abound. For example, ModaNova Textiles, a Turkish firm, has partially shifted production to Egypt while retaining design and administrative functions in Türkiye. Similarly, Denim Pro, a renowned denim brand, has opened a new facility in Egypt for cost-effective manufacturing. Entrepreneurs from Istanbul are already establishing warehousing facilities in Uzbekistan, with future plans to begin local production.
Table: Turkish textile industry at a glance
|
Indicator |
2022 Data |
2024 Data (approx.) |
Change/Notes |
|
Inflation (YoY) |
96% |
75% (currently) |
Persistently high, impacting production costs |
|
Minimum Wage (TRY) |
8,506 TRY |
17,002 TRY |
Doubled, increasing labor expenses |
|
TRY:USD Exchange Rate (approx.) |
18.6 TRY:1 USD |
40 TRY:1 USD |
Significant depreciation, imports costly |
|
Textile Workforce |
1.25 million |
< 950,000 |
Over 300,000 jobs lost |
|
Textile & Raw Materials Exports |
$9.5 billion (2024) |
-0.6% decline from 2023 |
Indicative of declining competitiveness |
|
Ready-to-Wear Exports |
$17.9 billion (2024) |
-7% decline from 2023 |
Signals pressure on finished goods sector |
Note: Data for 2024 and 2025 are approximate based on available reports and projections, and some figures may vary slightly across different sources.
Rebranding ‘Made in Türkiye’
While the flight of mass-market production seems inevitable, Türkiye still retains critical strengths. It is unlikely the country can or should compete with low-wage nations on volume. Instead, the opportunity lies in refocusing on high-value, premium textile production. The country’s niches include:
• Luxury & designer apparel: Türkiye’s craftsmanship and design acumen are ideal for short-run, high-margin fashion production.
• Technical & sustainable textiles: Innovations in bio-based fibers, smart textiles, and recycled yarns align with EU mandates and global demand.
• Custom and quick-turnaround manufacturing: Türkiye’s location enables faster deliveries to Europe compared to Asia—an edge for brands focused on agility and reduced inventory risks.
Efforts are already underway. Associations are promoting standards like GOTS (Global Organic Textile Standard) and OEKO-TEX, while companies increasingly adopt waterless dyeing, renewable energy sources, and traceability platforms to attract discerning international buyers.
Reinvention or retreat…
Türkiye’s textile sector stands at a juncture: on one path lies further deindustrialization, with factory closures and lost livelihoods; on the other, an ambitious reinvention into a leaner, greener, more premium manufacturing hub.
The global supply chain is evolving rapidly, rewarding adaptability and specialization. Türkiye’s future in textiles may no longer rest in quantity, but in quality, sustainability, and innovation. With strategic recalibration, the nation can still weave a compelling story for its iconic Made in Türkiye label—one not defined by cost alone, but by craftsmanship, credibility, and conscious manufacturing.

In a significant trade development, the United States has imposed a 25% tariff on all Indian imports, effective from Aug 01, 2025. This move deals a strong blow to India’s export sectors, particularly textiles, garments, and home furnishings. Announced by President Donald Trump on July 30, the tariff comes in response to India’s “high tariffs, non-monetary trade barriers, and continued energy trade with Russia.”
While the tariff raises concerns across India’s export-dependent sectors, a closer look at product categories reveals a mixed picture. Some segments appear more insulated due to limited competition, while others are exposed to cheaper alternatives from ASEAN nations.
US Imports From India: $10 bn textile pipeline at stake
In 2024, India exported nearly $10 billion worth of textiles and apparel to the US, accounting for approximately 28–29% of its global Textile & Apparel (T&A) exports. Globally, the U.S. imported $107 billion worth of textiles, making India its third-largest supplier.
However, India’s product-wise advantage isn't uniform. According to UN COMTRADE and Moneycontrol, India holds over 50% market share in key U.S. imports such as:
|
Product Category |
Imports from India ($ Mn) |
India’s Share of U.S. Imports (%) |
|
Cotton bed linen |
817.5 |
59.40% |
|
Textile fabrics printed/laminated with plastics |
273.6 |
56.60% |
|
Carpets knotted |
176.4 |
59.70% |
|
Carpets tufted |
141.8 |
72.40% |
|
Table linen, of cotton |
129 |
72.90% |
|
Toilet and kitchen linen |
78.1 |
50.50% |
|
Basketwork, wickerwork (partially textile) |
140 |
56.00% |
In total, more than $3 billion worth of U.S. textile imports have over 60% dependence on Indian suppliers, making them less vulnerable to sourcing shifts, even with the new tariffs.
Who’s Hurt Most? : HS Code impact breakdown
HS 61 – Knitwear & Cotton Apparel-Includes: T-shirts (6109), knitted trousers (6103)
● India’s U.S. Export: ~$2 billion
● Competitive Landscape:
○ Vietnam (20%) and Indonesia (19%) are now 5% cheaper than India post-tariff.
○ Bangladesh (35%), Cambodia (36%), and China (30%+) remain more expensive.
HS 63 – Home Textiles & Crafted Linen-Includes: Bed linens (6302), towels, table linens
● India’s U.S. Export: ~$2.5 billion
● Advantage: India’s design-led, artisan-rich goods face minimal ASEAN competition.
According to Moneycontrol, India supplied:
● 83% of U.S. carpets & rugs
● 73% of table linen
● Over 60% of 13 key textile lines
This makes HS 63 India’s most resilient export category despite the tariff hit.
HS 52 – Cotton Yarn & Fabrics
● India’s U.S. Export: $1–1.5 billion
This is a less competitive segment where India enjoys a significant scale advantage; ASEAN nations do not dominate here.
HS 62/63 – Handloom & Ethnic Fashion-Includes: Sarees, GI-tagged scarves, embroidered apparel
● India’s Share: ~$0.5–1 billion
These are unique products without mass-production competition from ASEAN.
Tariffs May Bite Short-Term, But India’s Position Remains Strong:Experts say
Rahul Mehta, Chief Mentor, CMAI, explains, “This will make our products 7% to 10% more expensive than some of our competitors, and it will certainly hurt our apparel exports to the US... but it’s not beyond our ability to face.”
Sanjay K Jain, Chairman, ICC National Textiles Committee, observes, “Vietnam & Indonesia have a 5% advantage—but China, Bangladesh, Myanmar, Cambodia are at a disadvantage. USA buyers want to reduce dependency on China & Bangladesh—so where will they go?” He adds, “India does not have capacity for more than 10% growth right now—but buyers already committed to India will continue. Yes, it's a 5% hit, but it's manageable.”
He warns, however, of a bigger concern: “The penalty threat linked to Russia is the real worry. India must act—remove the 11% import duty on U.S. cotton and use savings from oil to subsidize export duties on U.S.-bound goods.”
Competitor Tariffs: Who benefits?
|
Country |
Tariff to U.S. (Post-2025) |
|
Vietnam |
~20% |
|
Indonesia |
~19% |
|
Bangladesh |
~35% |
|
Cambodia |
~36% |
|
China |
~30% + extra duties |
|
India |
25% (new) |
Despite India’s setback, the tariff differential still positions it at par with or ahead of several major exporters, especially in home and ethnic textiles.
Near-term disruption, long-term opportunity?
According to Mehta, “Fortunately, this set-back has come at a time when we’ve just signed an FTA with the UK and are proceeding rapidly with the EU. So yes, it’s tough times—but not panic time.” Sanjay Jain echoes, “Maybe the bullish feel is gone—but certainly not bearish. Apparel growth will continue—India is in a neutral position globally.”
Strategic Takeaway: Where India stands strongest
|
HS Code |
Segment |
U.S. Value |
ASEAN Threat |
Tariff Advantage |
Outlook |
|
HS 63 |
Home textiles, table/kitchen linen |
$2.5 B |
Low |
High |
Least Hit |
|
HS 62/63 |
Handloom, artisanal fashion |
~$1 B |
Low |
High |
Most Resilient |
|
HS 52 |
Cotton yarn & woven fabrics |
$1–1.5 B |
Medium |
Moderate |
Stable |
|
HS 61 |
Knitwear, T-shirts, trousers |
~$2 B |
High (VN/ID) |
Low |
Moderate Hit |
Tactical response needed, not panic
The 25% tariff poses a challenge, but India’s dominance in key U.S. categories like home textiles, carpets, and ethnic linens acts as a natural buffer. The real exposure lies in cotton apparel, where Vietnam and Indonesia now gain an edge.The path forward may lie in policy action—as Jain suggests—removing cotton duties and incentivizing value-added exports using savings from Russian oil.
As global sourcing shifts and FTAs with the UK and EU move forward, India’s textile sector remains challenged but not cornered. Its resilience may yet convert this crisis into a competitive advantage.

The global fashion industry is on the threshold to cross the $1 trillion mark by 2027. Yet beneath the glitter of runways and the allure of digital lookbooks, a more pragmatic revolution is taking hold—one driven not by moodboards or muse-inspired silhouettes, but by numbers. Fashion in 2025 is not abandoning creativity; it’s weaponizing it with data. And at the heart of this shift lies a single truth: Key Performance Indicators (KPIs) are no longer optional—they are existential.
The rise of KPI-led fashion
For decades, fashion operated largely on instinct, trend cycles, and creative gut-feel. But in a world where fast fashion is competing with responsible sourcing, and personalization must scale globally, decision-making needs sharper tools. That tool is measurement.
In today’s hypercompetitive environment, where consumer expectations shift faster than hemlines, KPIs have become the new compass. They align artistic vision with operational discipline and serve as a common language from design studios in Milan to factory floors in Tiruppur. Gone are the days when “best guess” planning sufficed. As a stakeholder put it, “You can’t manage what you don’t measure—and in fashion, what you don’t manage bleeds money and trust.”
Why KPIs are the industry’s new lifeline
Bridging vision with execution: KPIs bring structure to a chaotic value chain. When designers, merchandisers, marketers, and supply chain teams align around the same measurable goals—like sell-through rates or time-to-market—decision-making becomes collaborative rather than siloed.
Reducing waste, increasing accountability: Fashion’s sustainability crisis is no secret. With overproduction and markdowns choking profit margins and landfills, metrics like return reasons and deadstock percentages help brands cut excess before it starts. Efficiency isn't just profitable—it's ethical.
Replicating success through insights: Creative success in fashion is often perceived as lightning in a bottle. But KPIs offer repeatability. By analyzing what designs outperform, why certain SKUs return more, or which campaigns convert better, brands can continuously refine and replicate their wins.
Driving financial discipline: Margins are thinning, and competition is unforgiving. By tracking the percentage of full-price sales or understanding how iterations impact development costs, companies can take control of profitability. KPIs make value creation measurable.
What to Measure: The KPI framework for 2025 and beyond
Fashion's complexity demands KPIs that span every facet of the business. Here's a breakdown of the essential metrics defining the smartest global brands.
Table: Product Performance: Tracking what sells, what stumbles
|
KPI |
Definition |
Impact |
|
Sell-through Rate |
Percentage of units sold versus units produced for each style |
Identifies popular styles and informs future production planning. |
|
Return Rate/SKU |
Percentage of returns for each product, tracked by specific reason (e.g., fit, quality, damage) |
Highlights product deficiencies and improves customer satisfaction. |
|
Time-to-Market (Days) |
Duration from initial sketch to product launch |
Streamlines the product development cycle and enables faster trend response. |
|
# of Bestsellers/Collection |
Styles that consistently exceed sales targets or sell out completely |
Identifies high-performing designs and informs future collection strategies. |
|
Per cent of Collection Sold at Full Price |
Percentage of items sold without markdowns |
Measures the effectiveness of pricing strategies and product desirability. |
Table: Development Efficiency: Accelerating creation without compromise
|
KPI |
Definition |
Impact |
|
Number of Iterations/Style |
Number of design revisions required before final sample approval |
Optimizes the design process and reduces development costs. |
|
Sample Approval Rate |
Percentage of samples approved on the first round |
Indicates the accuracy of initial designs and technical specifications. |
|
Per cent of Tech Packs Completed on Time |
Percentage of technical specifications delivered by their deadlines |
Ensures smooth production handoffs and adherence to launch schedules. |
|
# of Styles Completed vs. Planned |
Actual number of styles finalized compared to the initial seasonal plan |
Assesses planning accuracy and resource allocation efficiency. |
Table: Supply Chain & Production: Creating a transparent, timely backbone
|
KPI |
Definition |
Impact |
|
% of Materials with Verified Certifications |
Percentage of raw materials meeting specific sustainability or ethical standards |
Ensures compliance with industry standards and aligns with brand values. |
|
On-Time Delivery Rate from Suppliers |
Percentage of orders received from suppliers by the agreed-upon date |
Prevents production bottlenecks and ensures timely product launches. |
|
% of Suppliers with Full Traceability Data |
Percentage of suppliers providing complete supply chain information |
Essential for transparency and compliance with evolving regulations like the Digital Product Passport (DPP). |
Table: Sustainability KPIs: Beyond profit, towards purpose
|
KPI |
Definition |
Impact |
|
Average CO₂ Footprint/Product |
Carbon emissions associated with each product's entire lifecycle |
Reduces environmental impact and appeals to growing eco-conscious consumer base. |
|
% of Products with Repair/Reuse/End-of-Life Plans |
Percentage of products designed for circularity or responsible disposal |
Promotes circular economy principles and enhances brand reputation. |
|
Waste-to-Approved Sample Ratio |
Amount of waste generated per approved sample |
Minimizes material waste during the design and development process. |
|
Use of Deadstock or Recycled Materials (%) |
Percentage of materials sourced from existing inventory or recycled content |
Reduces reliance on virgin resources and promotes sustainable sourcing. |
Table: Innovation & Validation: Future-proofing product development
|
KPI |
Definition |
Impact |
|
% of New Styles Validated with Waitlists/Pre-orders |
Percentage of new designs generating early customer interest before mass production |
Reduces the risk of unpopular launches and gauges market demand effectively. |
|
# of User-Tested Prototypes/Season |
Number of prototypes tested with target consumers |
Ensures product-market fit and enhances user experience. |
|
% of Products with Customer Feedback Data Attached |
Percentage of styles with integrated customer reviews and feedback |
Informs future design decisions and improves customer satisfaction. |
|
% of Styles Integrated with a DPP |
Percentage of products linked to a Digital Product Passport for transparency |
Meets regulatory requirements and enhances brand transparency and trust. |
Table: Team & Strategy: Cultivating a data-driven culture
|
KPI |
Definition |
Impact |
|
# of Cross-Department Design Reviews Held |
Number of collaborative design review meetings between teams |
Fosters inter-departmental collaboration and strategic alignment. |
|
% of Collection Aligned with Brand DNA or Themes |
Percentage of styles reflecting core brand identity and seasonal narratives |
Maintains brand consistency and strengthens brand recognition. |
|
# of Styles Aligned with Business Goals (Margin, Timing, Audience) |
Number of styles meeting specific financial, timeline, and target audience objectives |
Ensures the product portfolio contributes directly to overall business success. |
From art to algorithm, its a new fashion era
In 2025, fashion brands no longer have the luxury of ignoring data. The stakes are too high, and the competition too agile. Those that fail to adopt a KPI-led mindset will struggle not just with profitability, but with relevance.
In a world where Gen Z demands authenticity, regulators demand transparency, and consumers demand speed, KPIs offer a single path forward: clarity. Because fashion’s future won’t be shaped by trends alone—but by those who know why the trend worked, how to replicate it, and what it contributed to the bottom line.
The newly launched 2024 Impact Report by the global leader in outdoor, active, and lifestyle products, Columbia Sportswear Company details the company's advancements across its three core corporate responsibility pillars: Empowering People, Sustaining Places, and Responsible Practices.
The comprehensive report showcases work accomplished by Columbia Sportswear's four primary brands: Columbia, SOREL, Mountain Hardwear, and prAna. A few of these notable achievements from 2024 include exceeding 80 per cent of their ‘Planet Water’ goal, which aims to provide 100,000 people daily with access to clean water; employees contributing over 6,100 volunteer hours to various causes; Mountain Hardwear receiving the Corporate Partner of the Year award from Leave No Trace; a significant reduction in absolute energy consumption at their Oregon distribution center and headquarters, with declines of over 900,000 kilowatt-hours and nearly 67,000 therms between 2022 and 2024 and the RISE industry initiative reaching over 425 workplaces and impacting more than 375,000 workers, over 65 per cent of whom are women.
In addition to these, Columbia Sportswear also completed a Sustainability Accounting Standards Board (SASB) disclosure for 2024, outlining its Environmental, Social, and Governance (ESG) efforts in accordance with industry-specific standards.
Founded in Portland, Oregon, in 1938, Columbia Sportswear Company connects active individuals with their passions through innovative apparel, footwear, accessories, and equipment. Its diverse portfolio of brands is sold in over 100 countries worldwide.
To be organized by the Development Commissioner for Handlooms, Ministry of Textiles and curated by the Material Library of India, the second edition of ‘Weave the Future 2.0: Celebrating Handlooms, Regeneration & Indigenous Cotton's Bright Future’ will open on National Handloom Day, August 7, 2025, and run until August 17, 2025, at the Crafts Museum in New Delhi.
The event will highlight the crucial role of handlooms in building a sustainable and circular textile economy in India. The exhibition champions traditional, nature-aligned practices, emphasizing how handlooms can enable mindful, culturally rooted, and circular production systems. It seeks to celebrate a new generation of textile artisans who are reimagining fashion through regenerative and handmade practices.
A significant focus is placed on promoting indigenous cotton varieties such as Kala Cotton, Punasa Cotton, Konda Patti Cotton, Gavran Kapus Cotton, and Jayadhar Cotton. These varieties are highlighted for being hardier, drought-resistant crops that support ecological balance and rural livelihoods. The event aims to raise awareness and build momentum to increase the current 2-3 per cent share of indigenous cotton in India's total cotton cultivation.
The event promotes ‘regeneration’ in textiles, encompassing not just recycling but also practices that restore and revitalize the environment and communities. It brings together approximately 30 participating brands and initiatives including a diverse group of weavers, artisans, designers, enablers (like Laudes Foundation and Regenerative Production Landscape Collaborative (RPL) in Madhya Pradesh), and grassroots implementers (such as KORA Collective and Khamir) who are actively involved in reviving regenerative textile practices.
The event will feature installations that expand the conversation around sustainability, craft, and storytelling. Examples include a soundscape installation by Sonam Khetan, an exploration of native cotton varieties by Kora Design Collaborative, and an eco-printed panel by Lafaani.
The National Council of Textile Organizations (NCTO) has applauded President Donald Trump for his executive order to eliminate the ‘de minimis’ exemption for all global commerce shipments, effective August 29.
Kim Glas, President and CEO, NCTO, issued a statement praising the decision, which addresses a long-standing concern for the American textile industry. For eight years, NCTO has campaigned against the de minimis loophole, which allows approximately 4 million packages daily to enter the U.S. duty-free and without rigorous inspection. Half of these shipments are estimated to be textiles and apparel.
The de minimis mechanism has functioned as a black box for low-cost, subsidized, and unethical Chinese imports, Glas states, highlighting how it undermines the competitiveness of US manufacturers. This loophole has facilitated the entry of goods made with forced labor from Xinjiang, China, and even illicit fentanyl, reaching American consumers unchecked, she emphasizes.
A key member of the Coalition to Close the De Minimis Loophole, NCTO thanked President Trump for recognizing the ‘severe impact’ of this provision. The executive order restores fairness for US manufacturers, closes a major gateway for illegal and toxic goods, and lays the groundwork for reinvestment and job creation here at home, Glas adds.
The organization notes, coupled with bipartisan legislation to codify the de minimis repeal by July 2027, this executive order effectively slams the door shut on one of the most damaging trade loopholes in US history. The US textile supply chain currently employs 471,046 individuals, generated $63.9 billion in shipments in 2024, and exported $28.0 billion in fiber, textiles, and apparel last year.
The global Home Textile Market is projected to grow by 4.2 per cent CAGR from 2025-33 to approximately $213.5 billion by 2033.
The market's steady expansion is primarily fueled by several key factors. These include consumers’ increasing expenditure on home décor with the rise of urbanization and a greater emphasis on interior aesthetics. These are fuelling demand for products like bed linen, curtains, towels, and upholstery fabrics, driven by evolving lifestyle trends and increasing disposable incomes, particularly in emerging economies. The booming real estate and hospitality sectors are also contributing significantly to market growth.
Furthermore, eco-friendly and sustainable textiles are gaining considerable traction, reflecting a growing consumer awareness of environmental concerns. The accessibility and sales of home textile products have also been significantly boosted by the rise of e-commerce platforms.
Looking ahead, ongoing technological advancements in fabric manufacturing and digital printing are expected to continue shaping and influencing the market landscape.
Renowned Italian luxury group, Ermenegildo Zegna NV and Venezio Investments. an indirect wholly-owned subsidiary of Singapore-based investment company Temasek Holdings have entered into a significant investment agreement.
According to this agreement, Temasek has agreed to purchase 14,121,062 of Zegna's treasury shares at $8.95 per share. This price aligns with the volume-weighted average of ZGN share prices from June 30 to July 25, 2025.
With this new transaction, combined with its previous acquisition of 12,699,981 ordinary shares through market purchases, Temasek's total stake will reach 10 per cent of Ermenegildo Zegna Group's ordinary share capital outstanding after the deal closes.
Ermenegildo ‘Gildo’ Zegna, Chairman and CEO, states, their investment is a strong endorsement of the company’s vision and long-term growth potential, while firmly recognizing the global significance of the Italian luxury sector. Temasek’s partnership helps the company strengthen their organic expansion globally and to reinforce their unique role as a custodian of truly authentic brands.
Nagi Hamiyeh, Head-EMEA, Temasek, highlights the investment as a commitment to supporting leading European businesses with global potential. Having successfully established itself in the high-end luxury segment, the Ermenegildo Zegna Group presents significant long-term value creation opportunities across each brand, states Hamiyeh, adding, Temasek looks forward to being a ‘thoughtful, long-term partner’ to the Zegna family and management team.
Upon the transaction's closing, the Ermenegildo Zegna Group will receive a total cash consideration of $126.4 million. This injection will help boost the Group's balance sheet, providing enhanced financial flexibility to seize opportunities for accelerating the organic growth of its brand portfolio. Temasek's extensive experience in the luxury sector and deep knowledge of the Asian market are expected to significantly contribute to Zegna's growth prospects and support expansion in key underdeveloped geographies.
Italian luxury fashion house Prada SpA announced a robust 9 per cent Y-o-Y increase in its consolidated net revenues, reaching €2.74 billion (~$3.15 billion) for during H1, FY25 ended June 30, 2025. This growth was attributed to high brand desirability and creative momentum across all regions, despite a turbulent macroeconomic environment. Retail sales notably climbed 10% year-on-year to €2.45 billion (~$2.81 billion), fueled by sustained momentum in both established and emerging markets.
The Group's Adjusted EBIT stood at €619 million, representing a healthy margin of 22.6 per cent, consistent with the previous year despite increased investments in brand development. Net income for the period reached €386 million, and Prada concluded the semester with a solid net cash position of €352 million, even after a €398 million dividend payout and €294 million in capital expenditure.
Miu Miu emerged as the Group's standout performer, with retail sales rising by an impressive 49 per cent Y-o-Y in H1, FY25 and 40 per cent in Q2, FY25. The brand's strong appeal spanned across product categories and geographies, boosted by initiatives like Miu Miu Upcycled, Miu Miu Custom Studio, and new immersive store experiences, including a three-story boutique in SKP Wuhan and a redesigned New Bond Street flagship.
In contrast, the Prada brand faced challenging comparative figures and a subdued global demand, recording a resilient but slight retail sales decline of 1.9 per cent in H1 and 3.6 per cent in Q2. Despite this, Prada continued to build cultural relevance through dynamic storytelling campaigns and expanded its physical presence with key launches like Prada Men on 5th Avenue and the Mi Shang Prada Rong Zhai hospitality venue in China.
Acknowleding the challenging backdrop, Patrizio Bertelli, Chairman and Executive highlighted the results as beign a testament to the brands’ strength and disciplined execution. Andrea Guerra, Group CEO attributed the performance to the cultural relevance of our brands, their creativity and ability to anticipate and interpret contemporaneity.
Geographically, Asia Pacific posted a 10 per cent increase in retail sales, maintaining strong momentum. Sales in Europe also grew by 9 per cent, while the Americas showed continued recovery with a 12 per cent increase. Japan saw a 4 per cent rise, and the Middle East significantly outperformed with a 26 per cent jump in retail sales.
In strategic moves, the Group announced in April its acquisition of Versace from Capri Holdings for €1.25 billion, expected to close in H2 subject to approvals. Prada Group also completed a 10 per cent equity investment in Rino Mastrotto Group, a global leather and luxury manufacturing services supplier. Sustainability efforts continued across raw materials, chemical management, and traceability.