"POINTERS • Lowest growth this fiscal year in four years • The annual index value dipped to 2.56 FY 2017-18 from 3.43 points in FY 2016-17 • The entire fiscal year was marked by low business sentiment • Even the festive period did not bring much cheer • Q4 was the best quarter, reflecting a recovery."
 POINTERS • Lowest growth this fiscal year in four years • The annual index value dipped to 2.56 FY 2017-18 from 3.43 points in FY 2016-17 • The entire fiscal year was marked by low business sentiment • Even the festive period did not bring much cheer • Q4 was the best quarter, reflecting a recovery
In all four quarters this fiscal year (2017-18), the index values were much lower than comparable quarters in previous fiscal. The annual index value dipped to 2.56 in FY-2017-18 from 3.43 points in FY-2016-17, 5.32 points in FY-2015-16 and 7.28 points in FY-2014-15 -- reflecting 'dismal' growth. The entire fiscal year was marked by low business sentiment including the festive period, perceived as best the time to make up for turnover losses, when buying is high.
The index value was the lowest for July-Sept 2017 (Q2) at 1.87; followed by 2.71 points in Oct-Dec 2017 (Q3);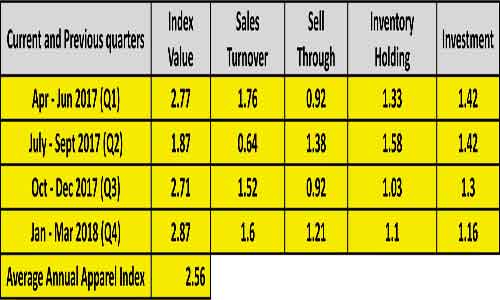 2.77 points in Apr-Jun 2017 (Q1); and 2.87 points Jan-Mar 2018 (Q4). In fact, Q4 was the best quarter this fiscal, indicating a recovery. The positive aspect is: the Index has been growing in the last two quarters.
All quarters are reviewed and compared to previous year’s quarters and the comparison is done at the assumed base value of 100.The average off our indices belonging to four quarters of the financial year is the final annual apparel index value.
Slack indices add to slowdown
The Sales Turnover graph over first two quarters followed a downward trend; the fall in July-Sept 2017 was the highest, it then moved up in the remaining two quarters Oct-Dec 17 at 1.52 and Jan-Marc ’18 growing to 1.60. Overall, Sales Turnover was never high throughout the fiscal.
Sell Through, Investments and Inventory Holding though not very dynamic, were never strong enough to influence the index greatly, as the graphs indicates.
The graph below shows varying growth rates for all performance factors over four quarters.
A dip in Sales Turnover, Sell Through and Investment graph and index should not be mistaken as a dip in sales, instead it indicates the rate of growth slowed down but in value and absolute terms there was growth in sales turnover.
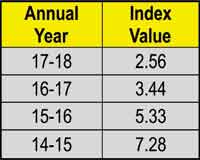
Trendspotting: Four year low, it’s a dipping Annual Apparel Index
Annual Year Index Value
A closer look at the last four financial years indicates Apparel Index was much higher in FY 2014-15 and FY 2015-16 at 7.28 and 5.33 respectively compared to FY 2016-17 at 3.44 and 2.56 in FY 2017-18 , which is almost 35 per cent growth rate of what it was in FY 2014-15.
The onus for the dismal performance in the last two years could be attributed to demonetization and implementation of GST which have disrupted market sentiment and overall growth.